 |  |
PERT Charts are a project management tool that allow teams to be able to see a project broken down to nodes, otherwise known as tasks. Arrows are a pivotal component of PERT Charts, as they indicate the sequence of events and illustrate what must be done in order for the project to progress. This tool is helpful not only for establishing tasks, but also determining what sequence would best result in a critical path.
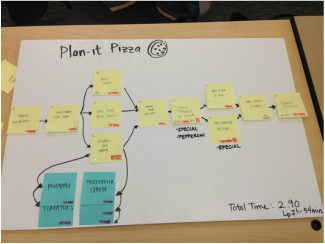
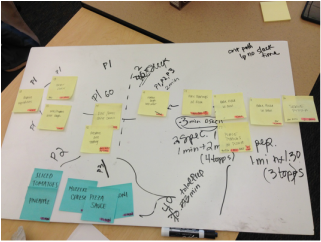
Our team was able to practice this project management method last week. The PERT Chart illustrates the necessary steps of making a pizza. We had the objective of organizing the PERT Chart so that we could make a pizza in the least amount of time while also avoiding any slack time. Through the exercise, we learned to come up with alternative solutions, determine valid estimates of how long each task would take, and be flexible with how we chose to sequence the nodes. Through the use of the PERT Chart, these lessons can easily apply to our own project. PERT Charts that represent larger projects are more complex, and have a greater potential to illustrate more branching off of sub tasks. We will have to address this challenge when we create PERT Charts for our project in the coming week.
Our team was able to practice this project management method last week. The PERT Chart illustrates the necessary steps of making a pizza. We had the objective of organizing the PERT Chart so that we could make a pizza in the least amount of time while also avoiding any slack time. Through the exercise, we learned to come up with alternative solutions, determine valid estimates of how long each task would take, and be flexible with how we chose to sequence the nodes. Through the use of the PERT Chart, these lessons can easily apply to our own project. PERT Charts that represent larger projects are more complex, and have a greater potential to illustrate more branching off of sub tasks. We will have to address this challenge when we create PERT Charts for our project in the coming week.
 RSS Feed
